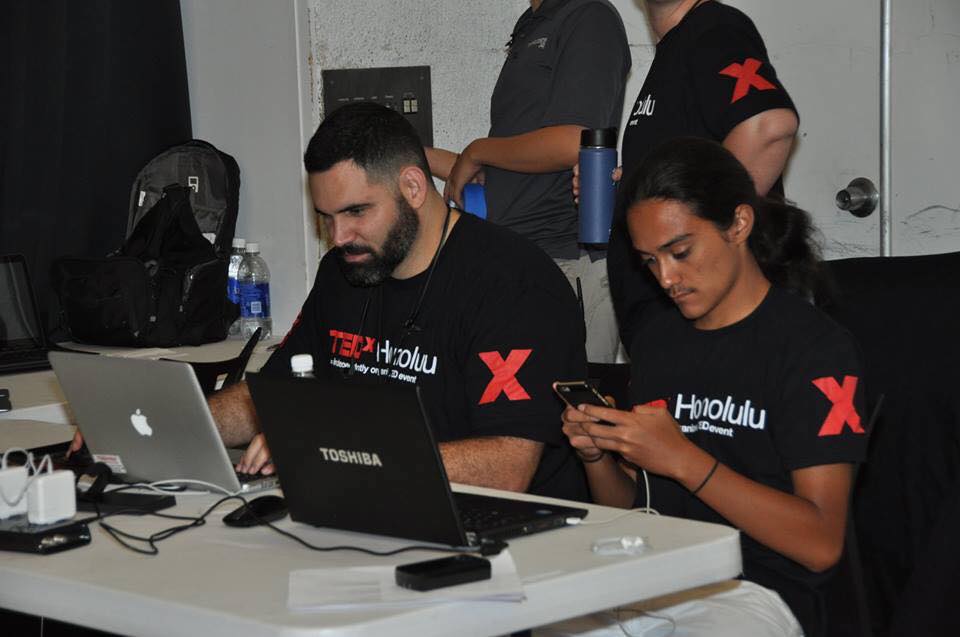
2014 event: Monitoring Social Media feeds
My TED Bio
TEDx Honolulu 2015-2016 Blaisdell Concert Hall event
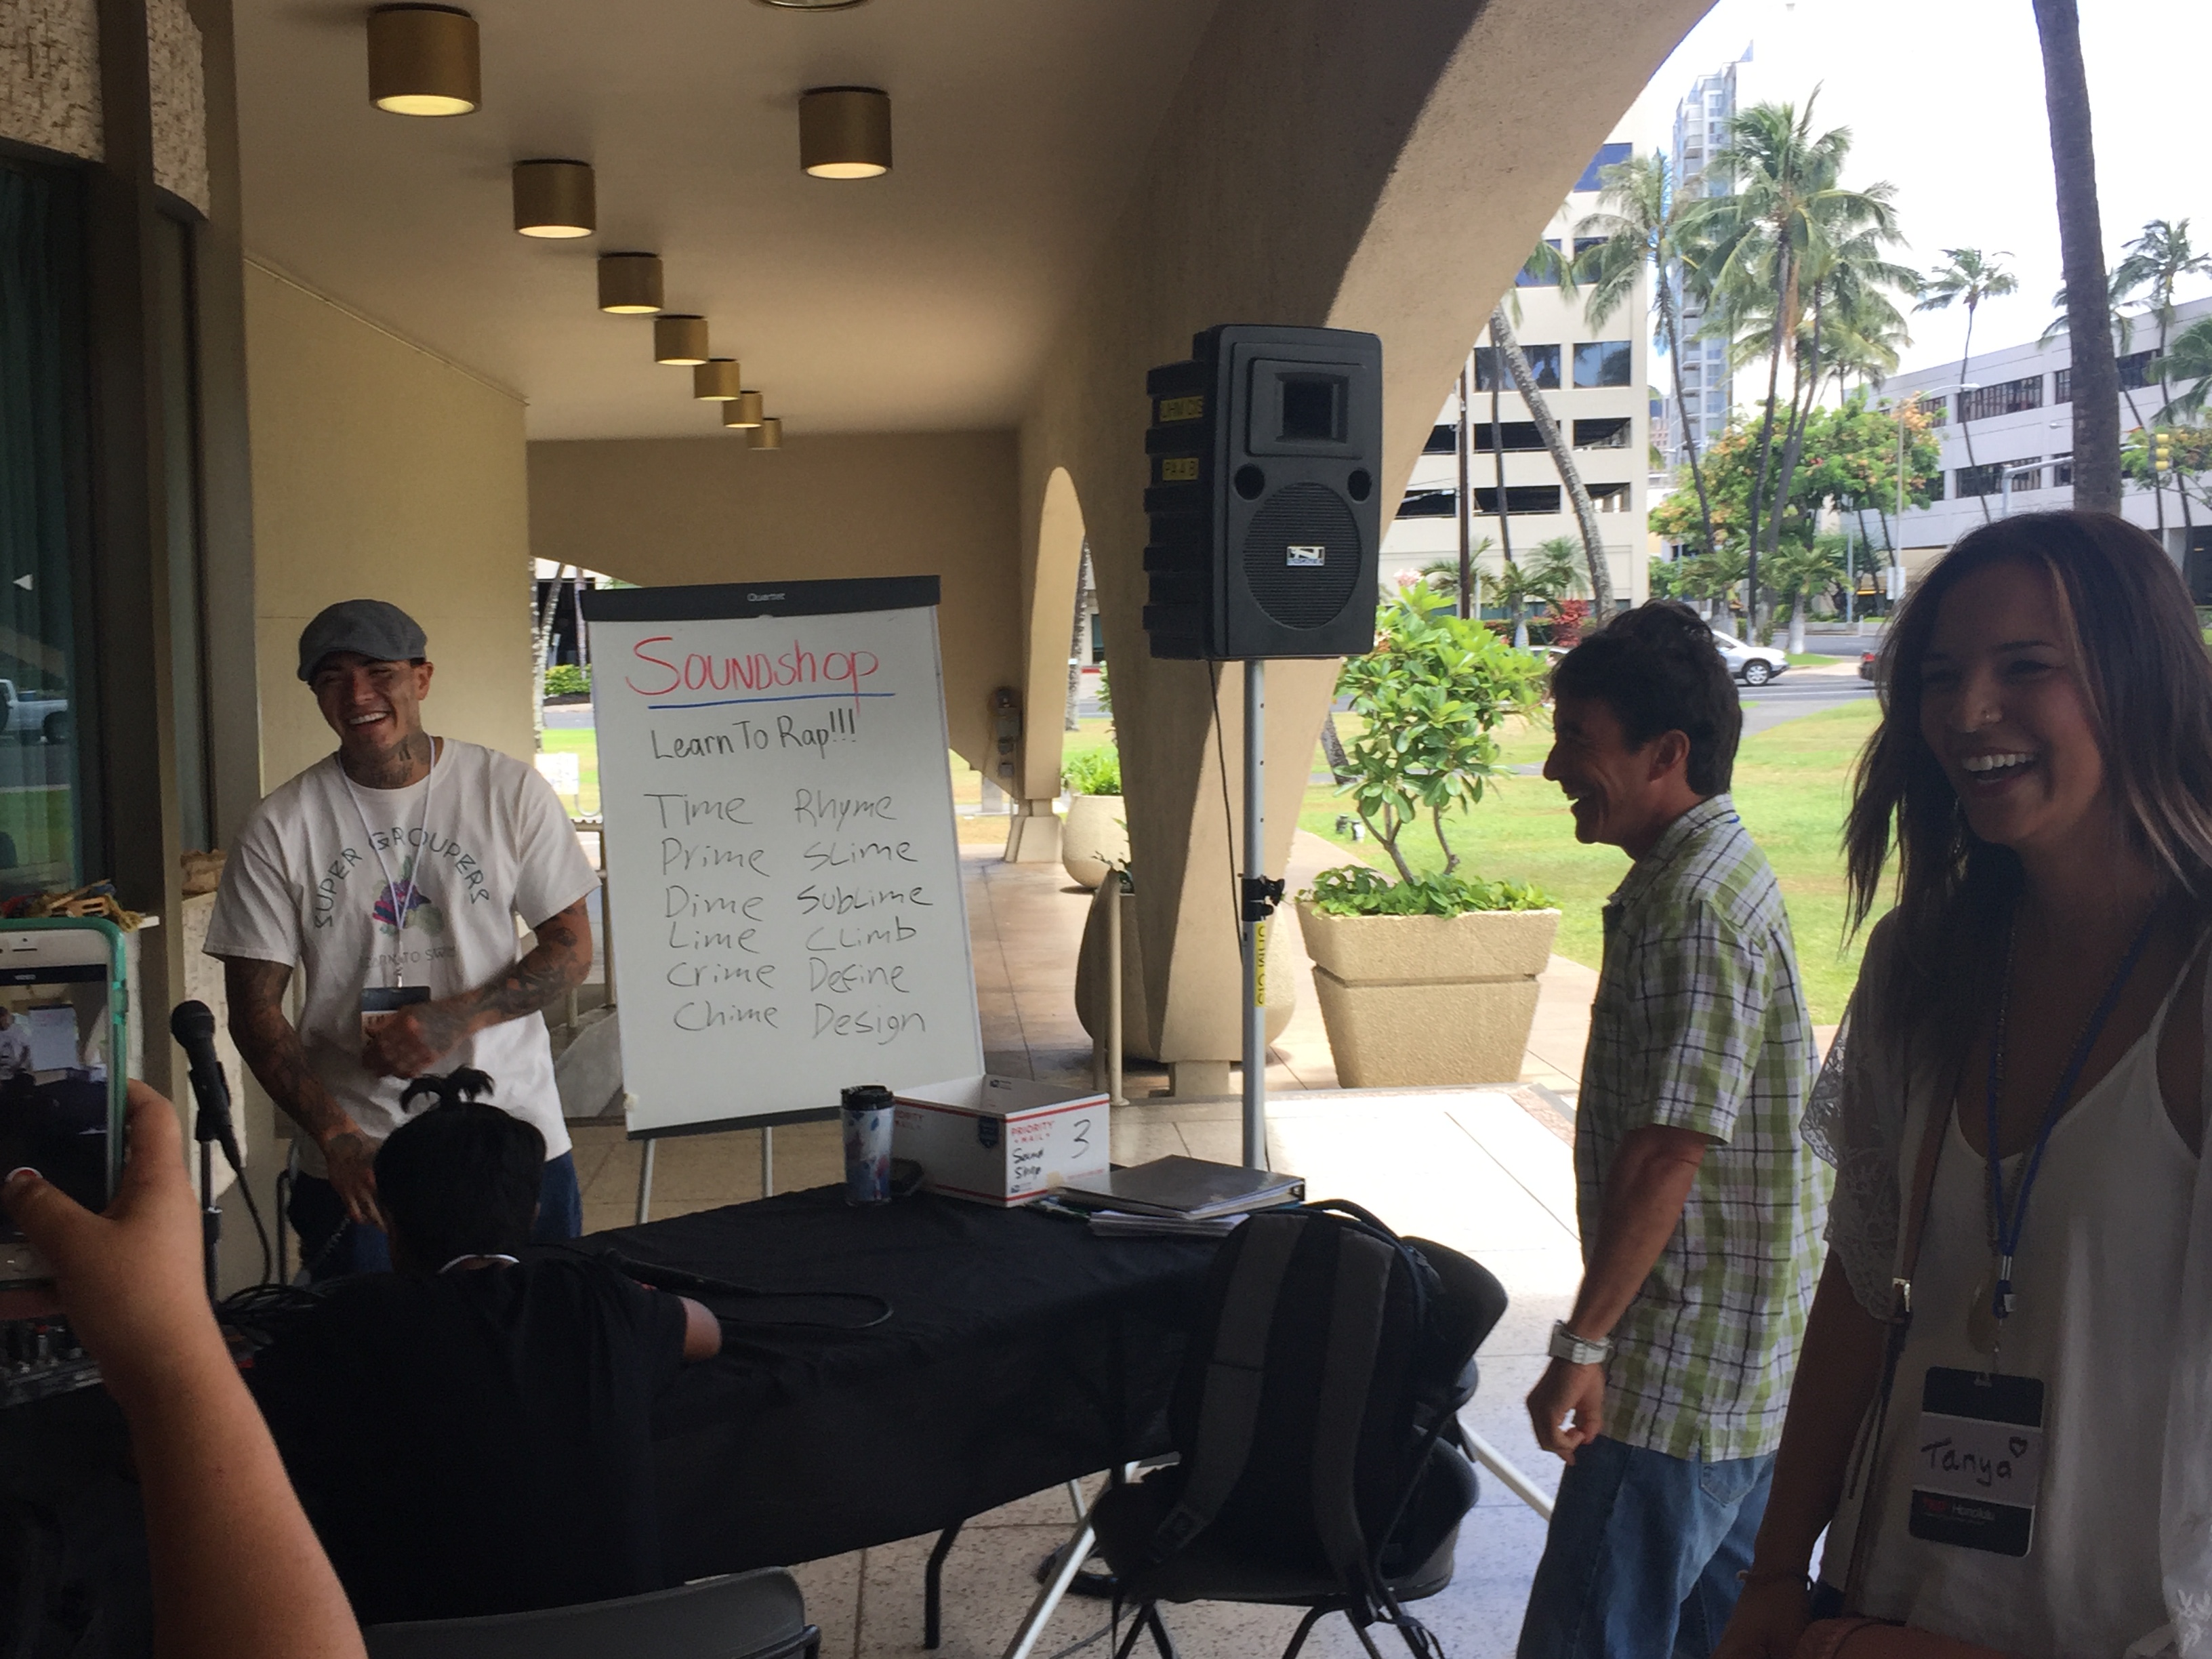
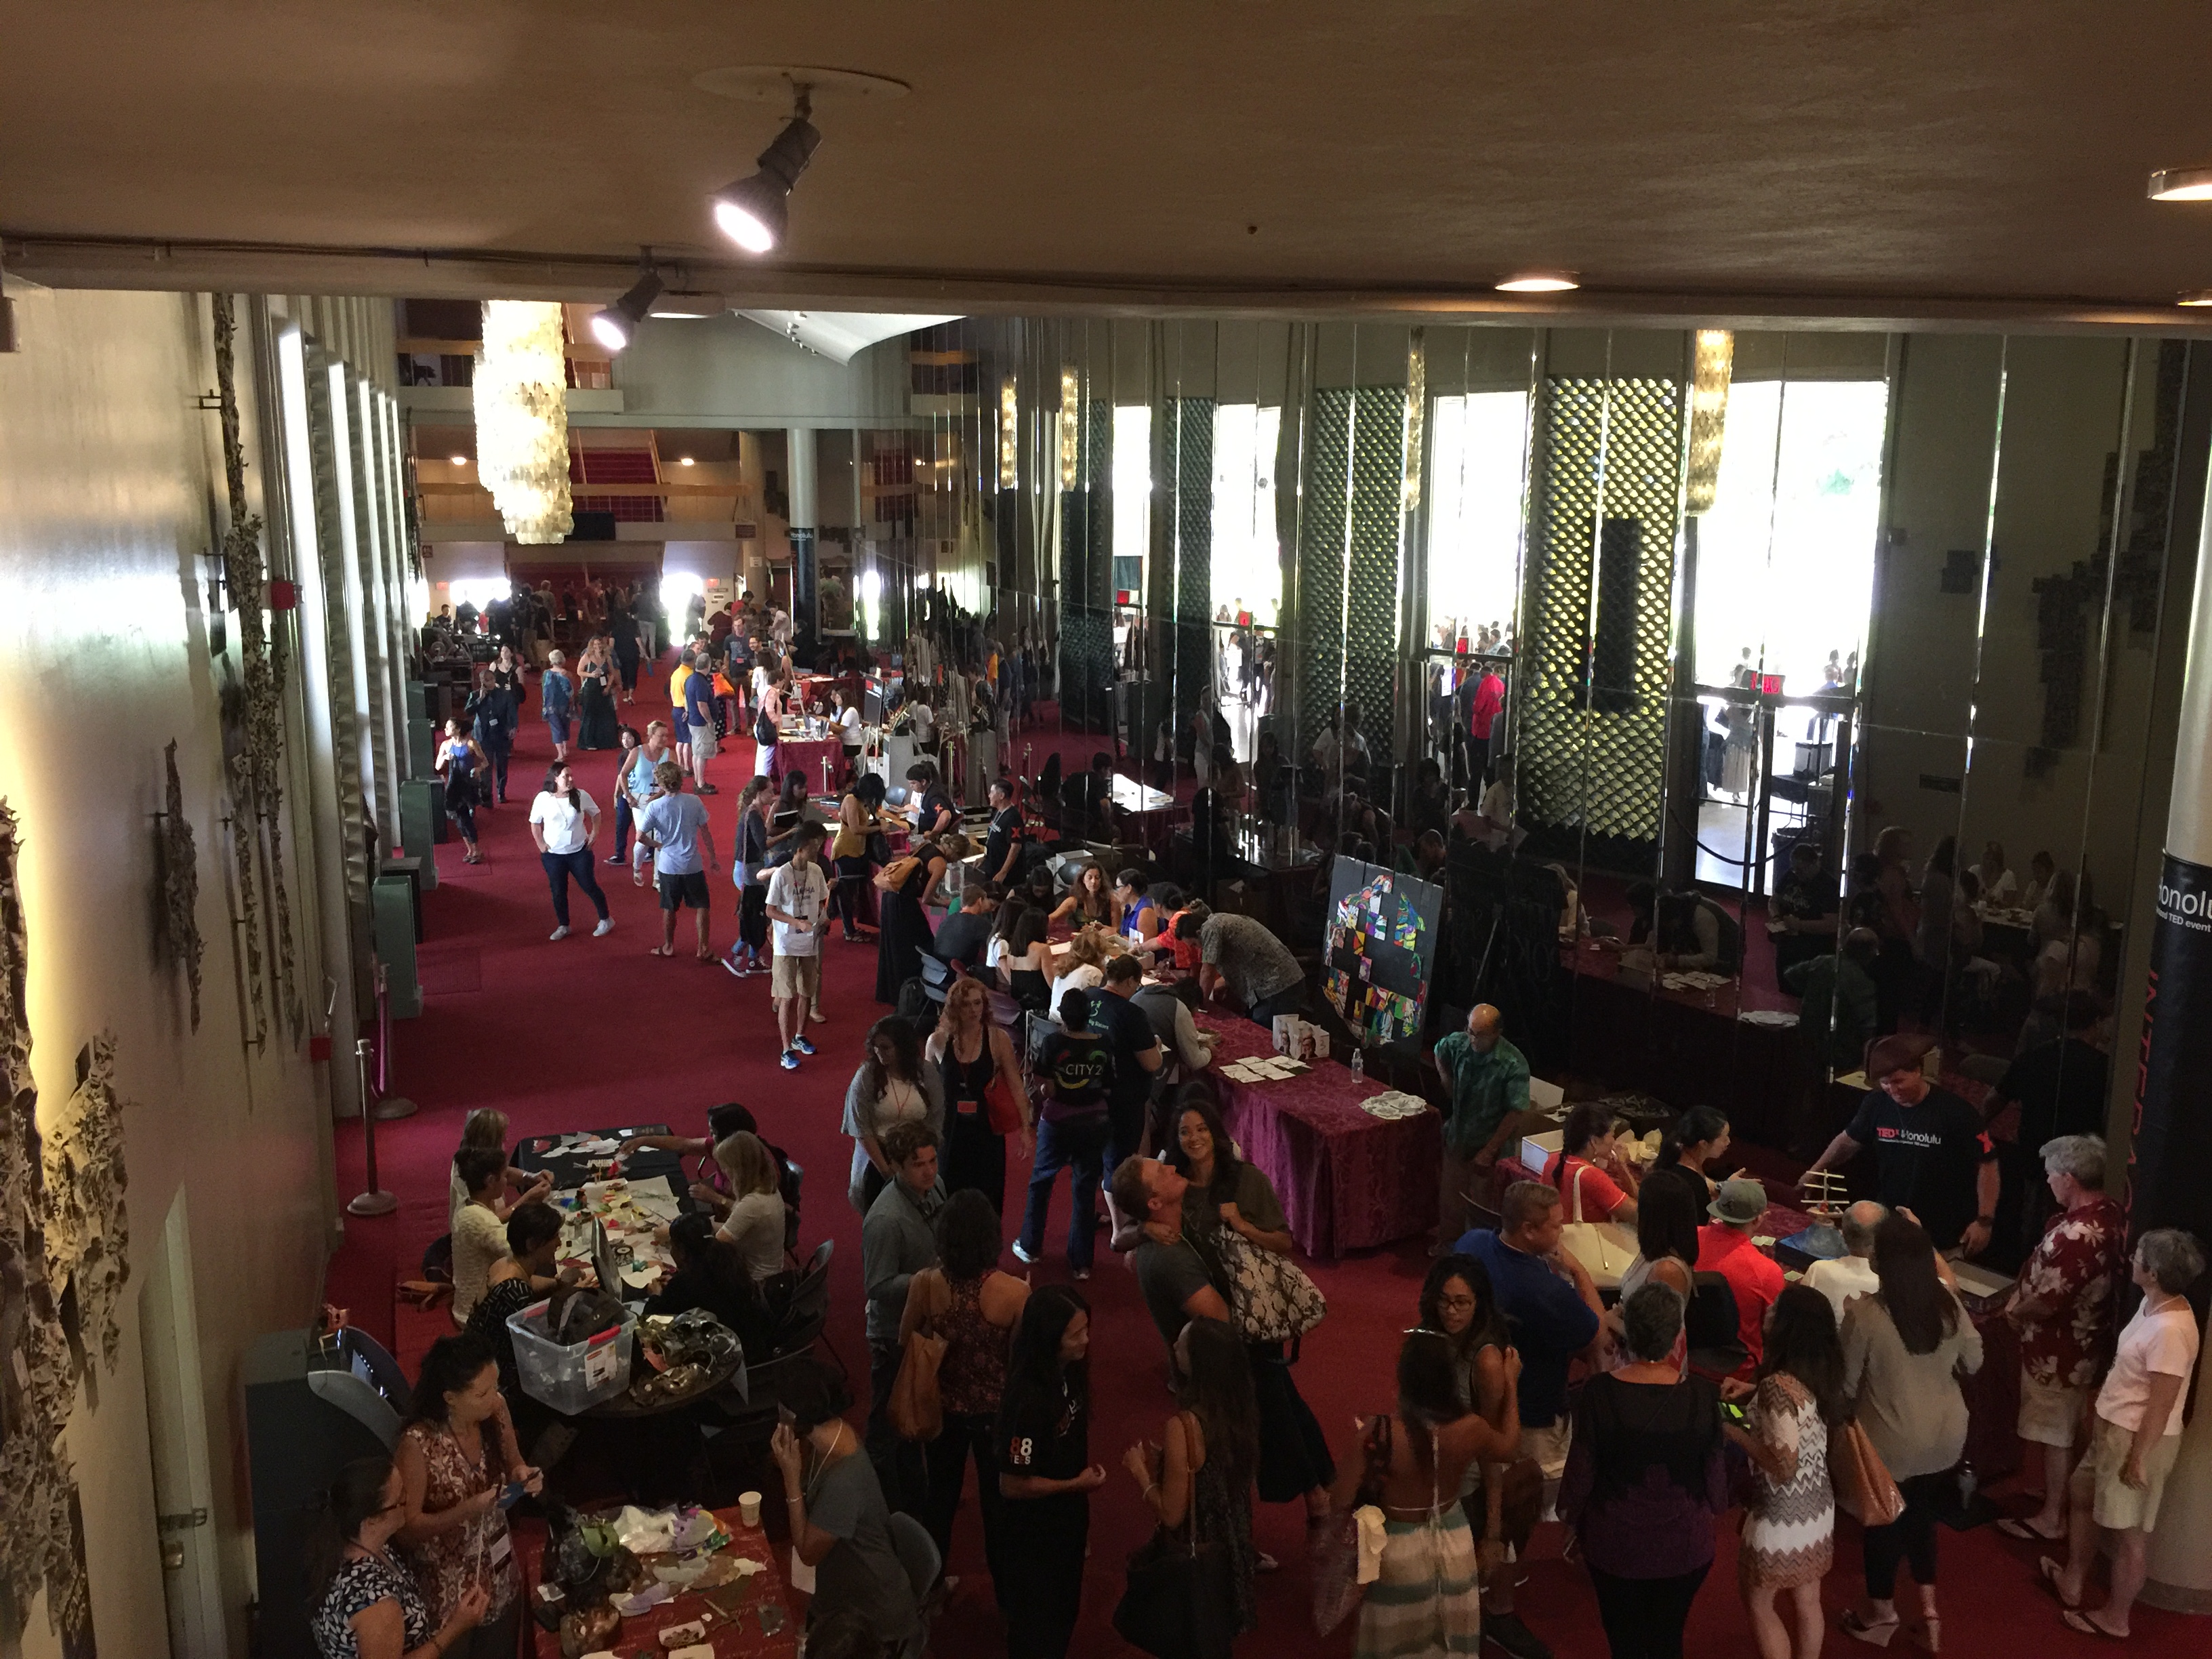
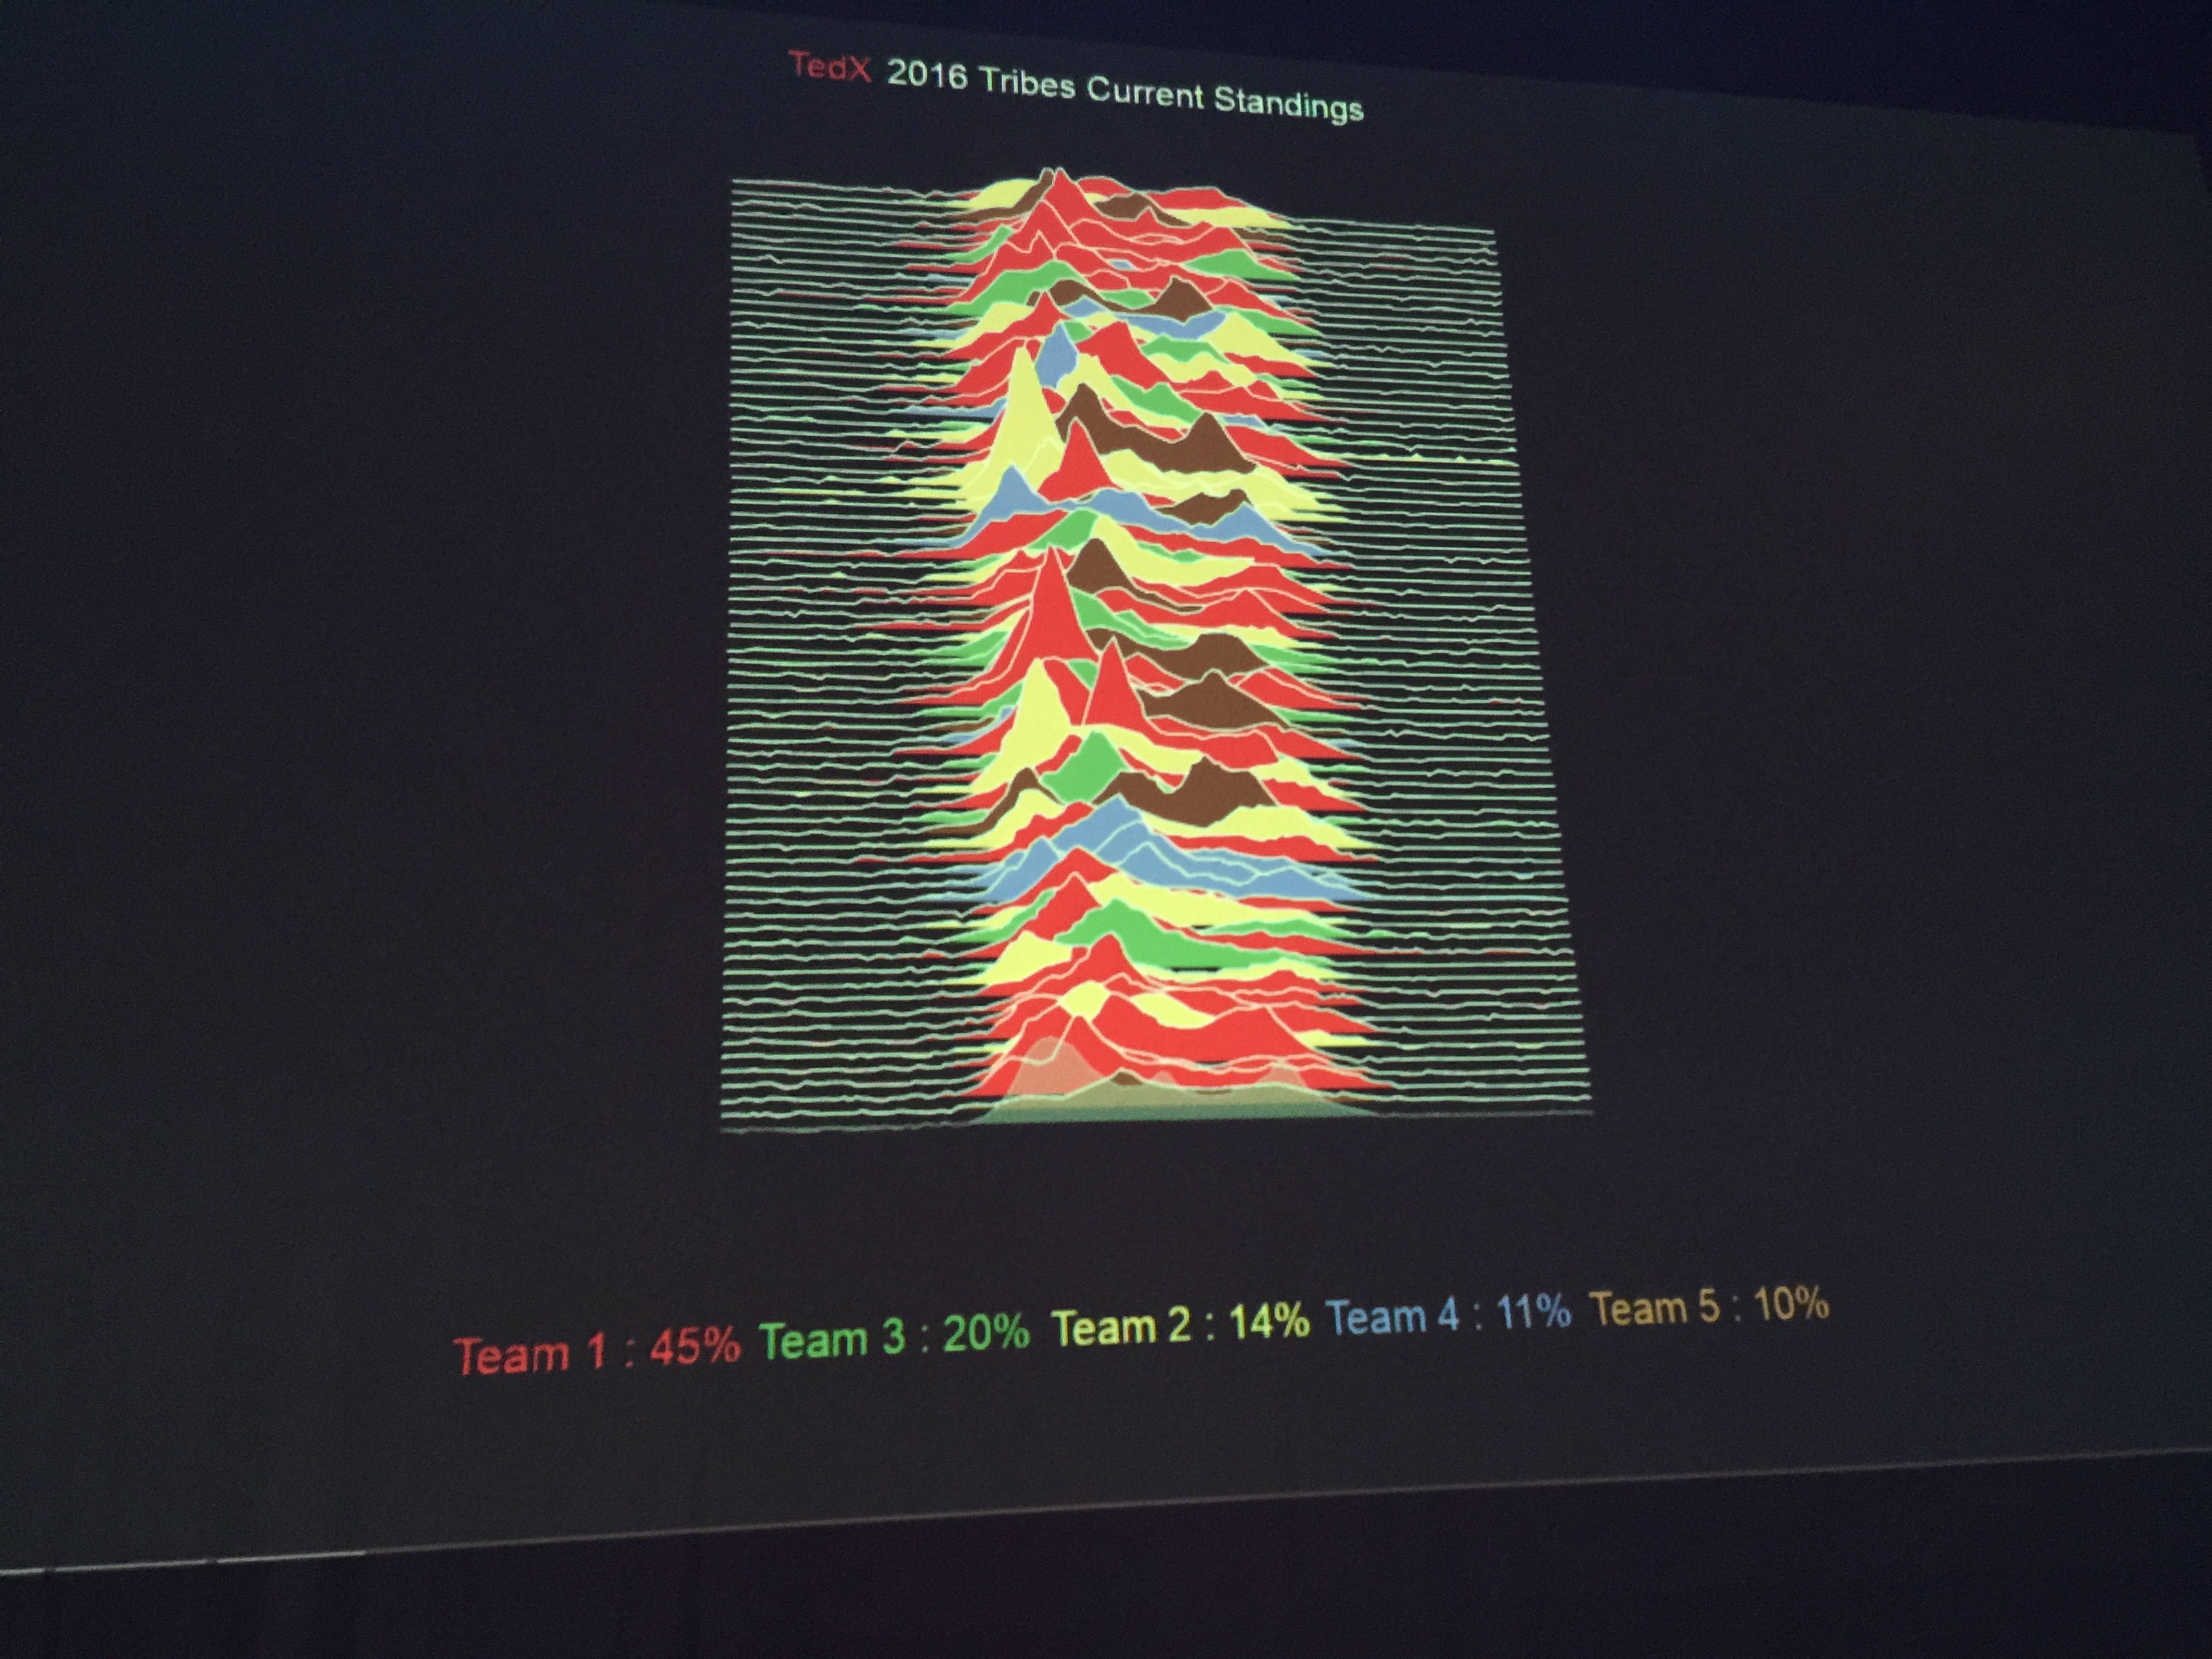
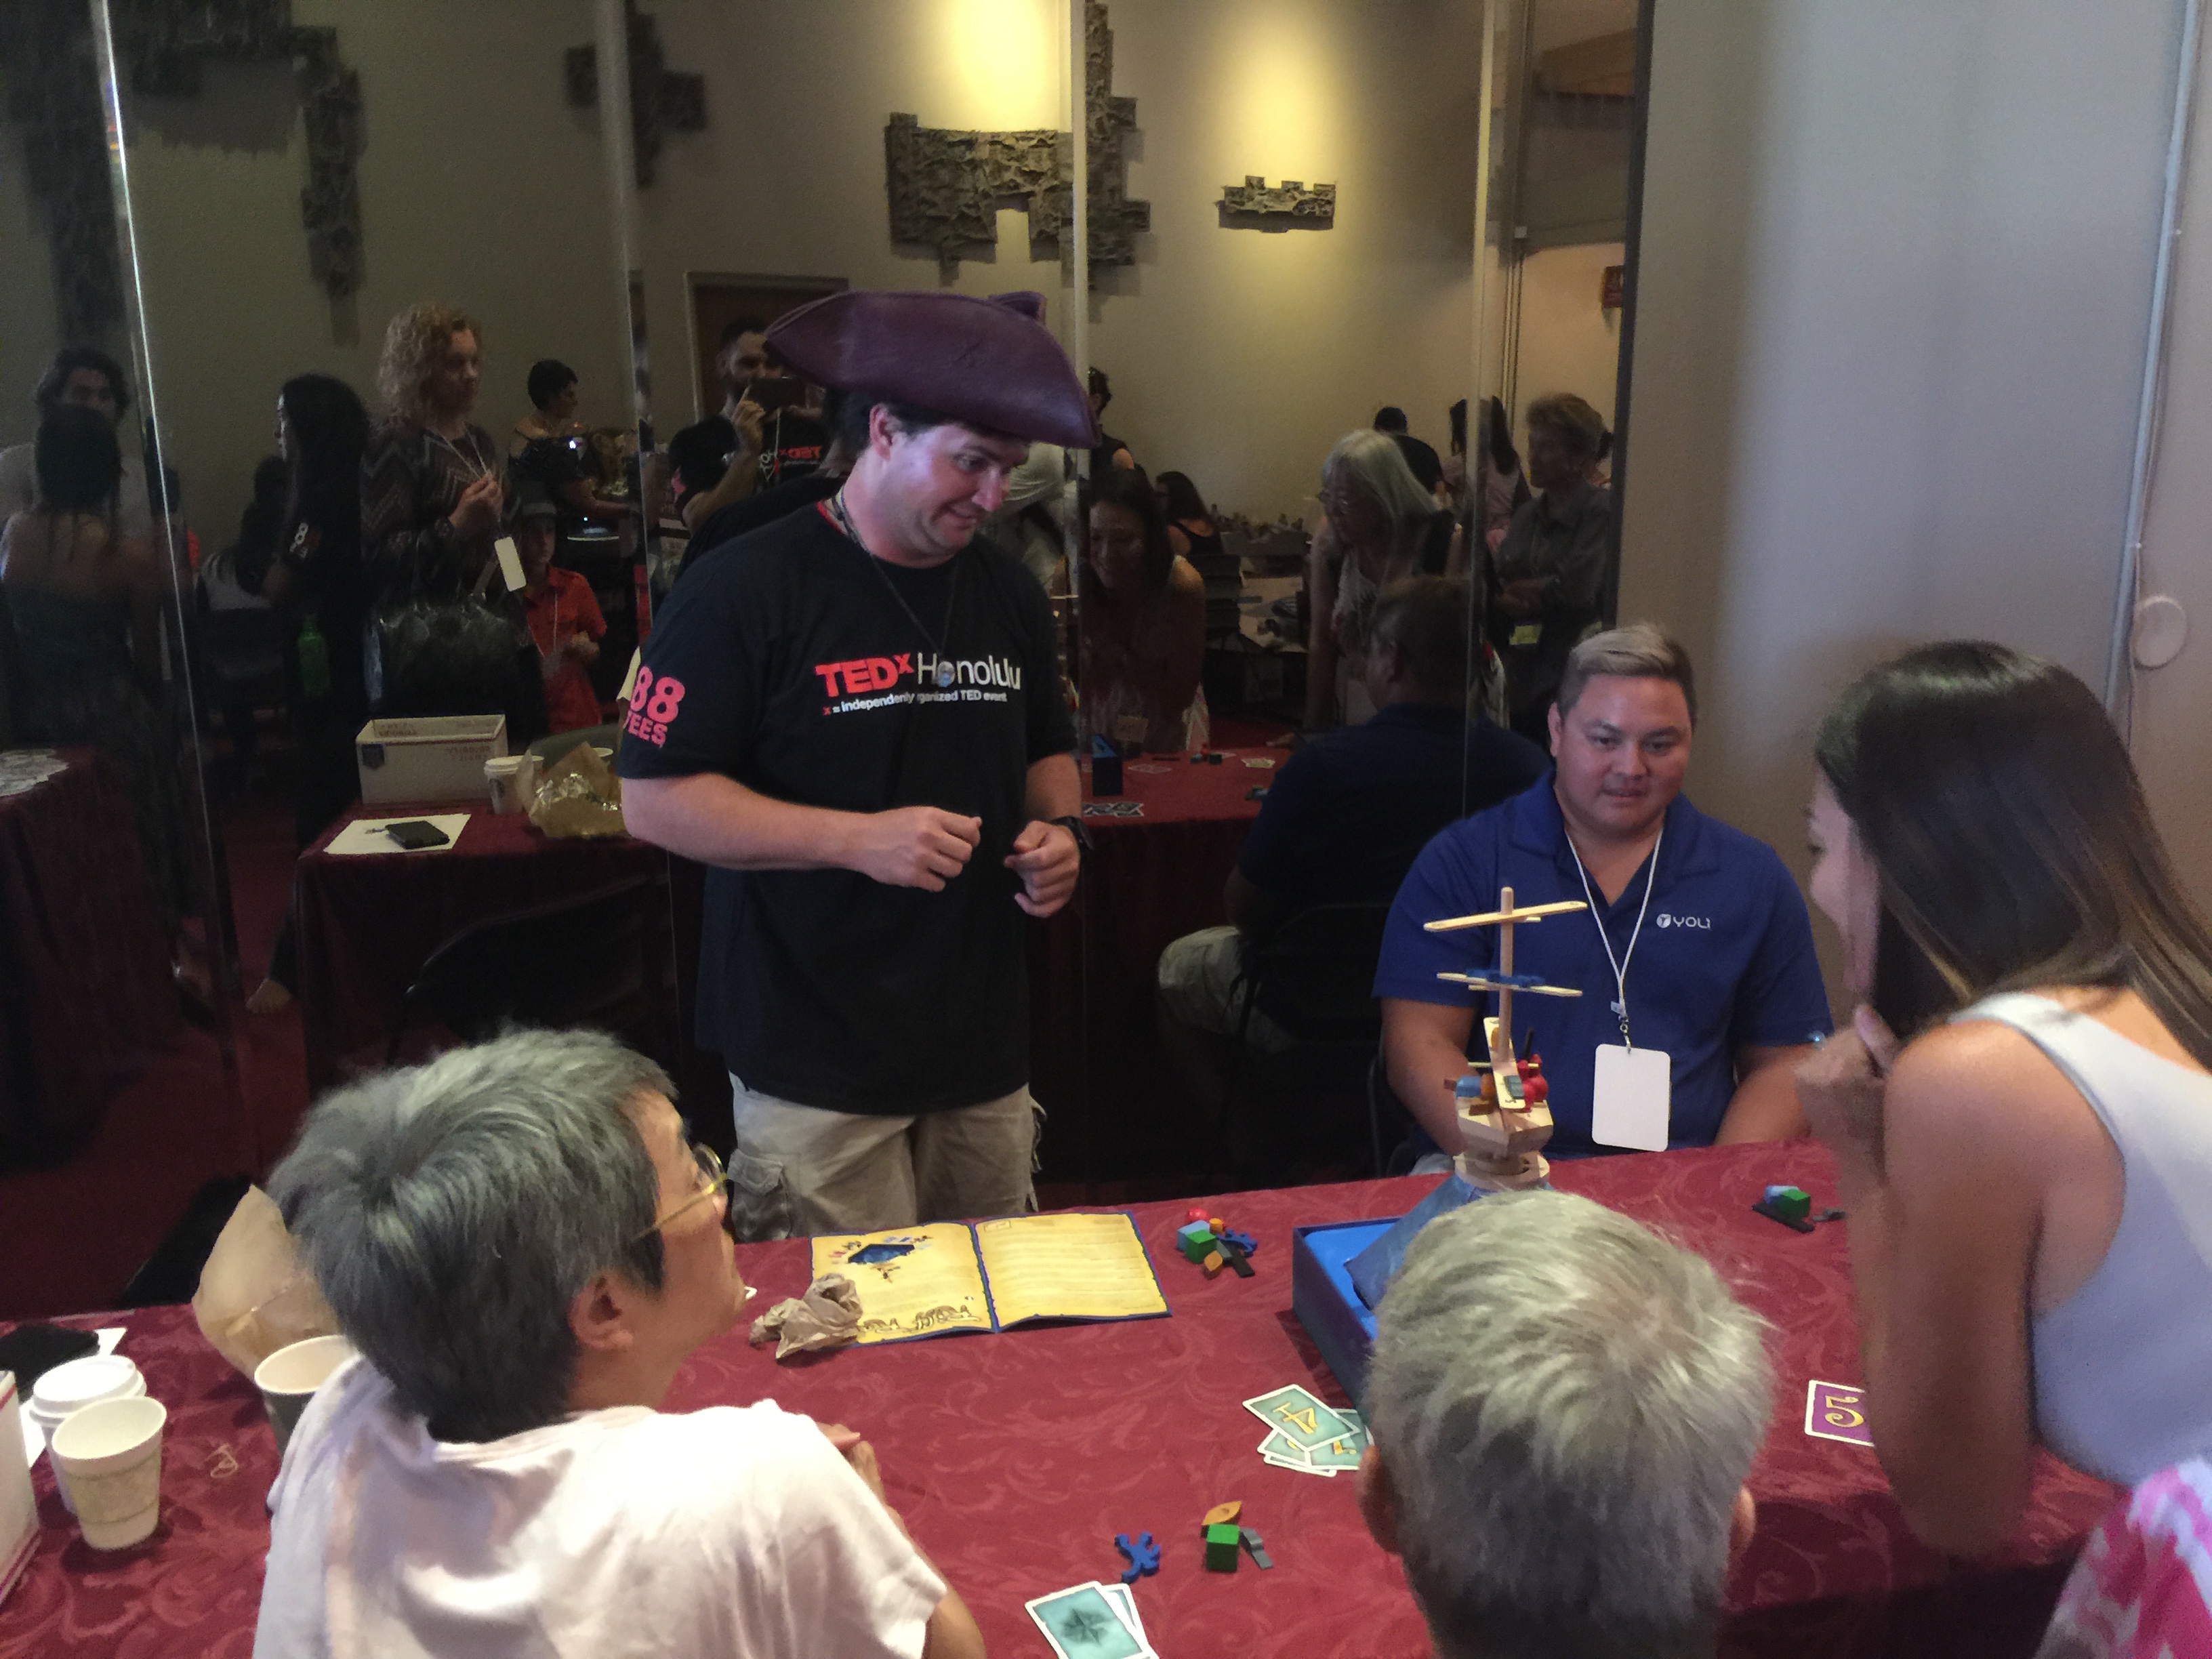
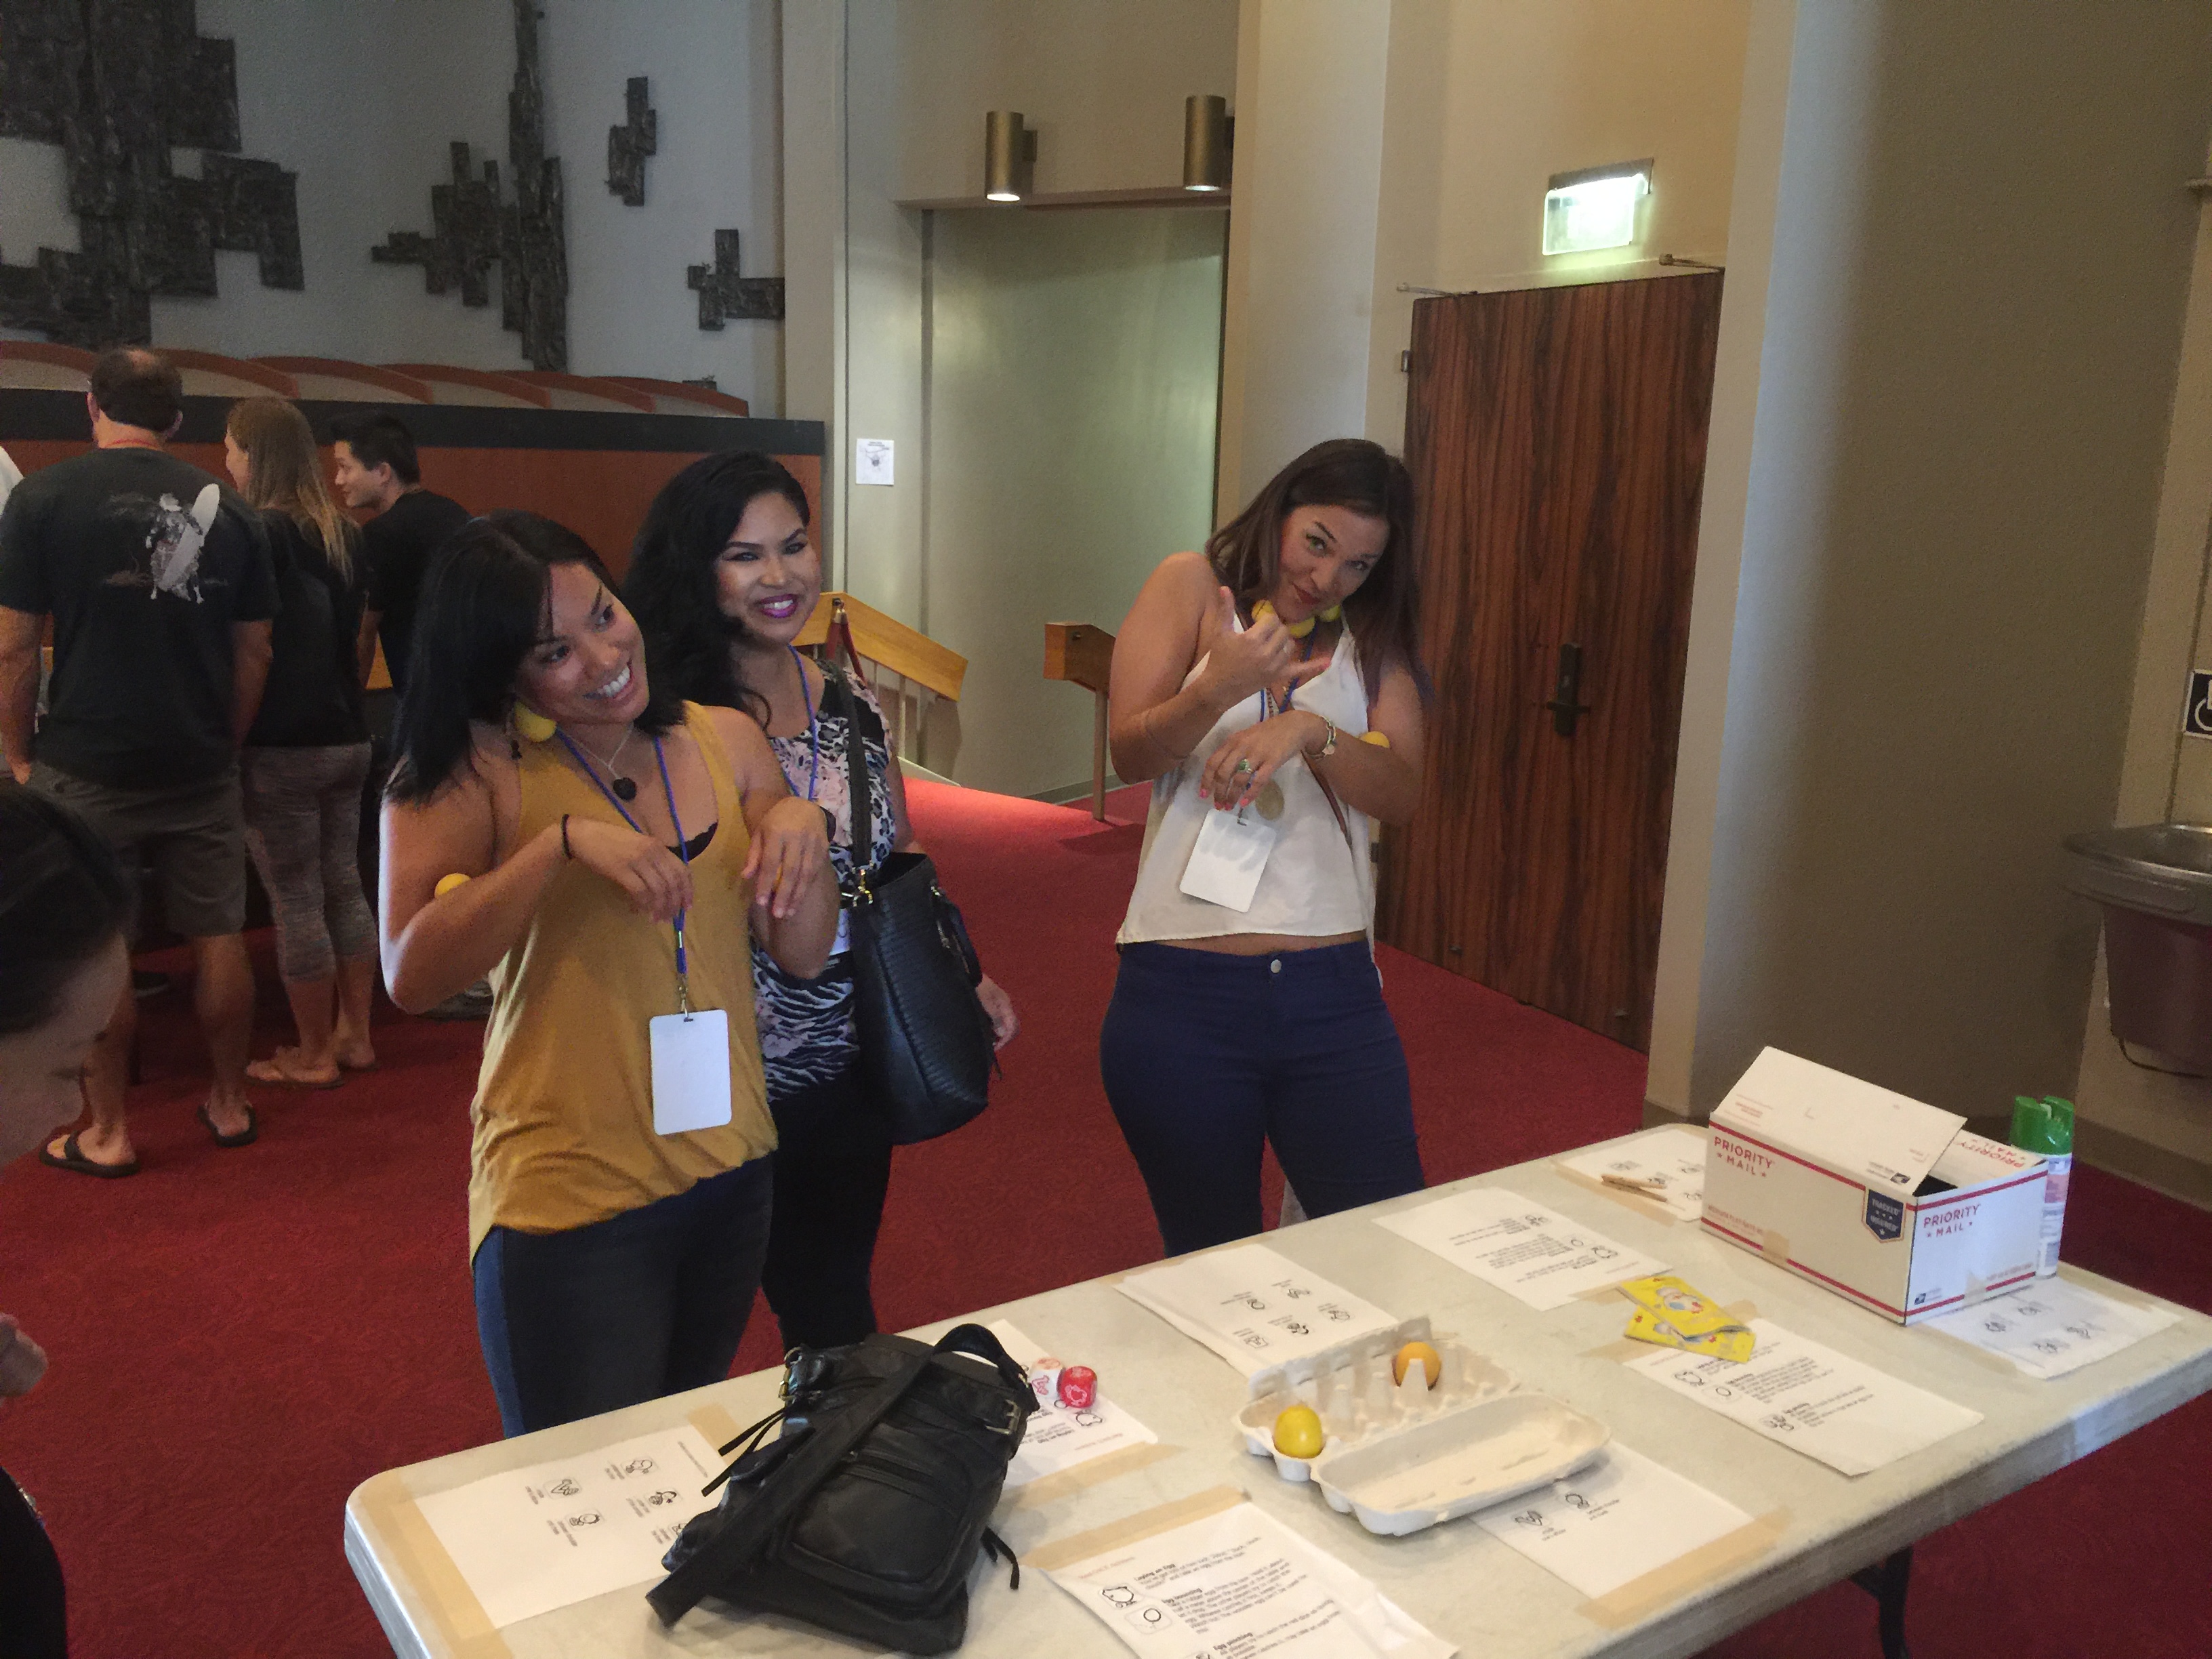
Our most ambitious project to date. My role as the Interactive director was to gamify the event. When an attendee arrives, they would be assigned to a tribe. Each tribe is associated with a speaker. We made some exceptions, if the attendee wanted to be part of a speakers tribe, for example. Then, in between talks, each attendee would participate with various activities outside of the hall. These included various board games, hip hop rap-alongs, meditation circles, interactive art and more. The participant would then receive beans (yes...actual beans!) for their participation. They would then have the choice to drop their beans into one of the 5 buckets. Each bucket is represented by a different color. Each color is also associated with a speaker & tribe. These buckets were weighted through out the event. Before the beginning of the next session, the weight data would be fed into a Joy Divsion-esque data visiualization chart that showcased where each tribe stood in terms of rank.
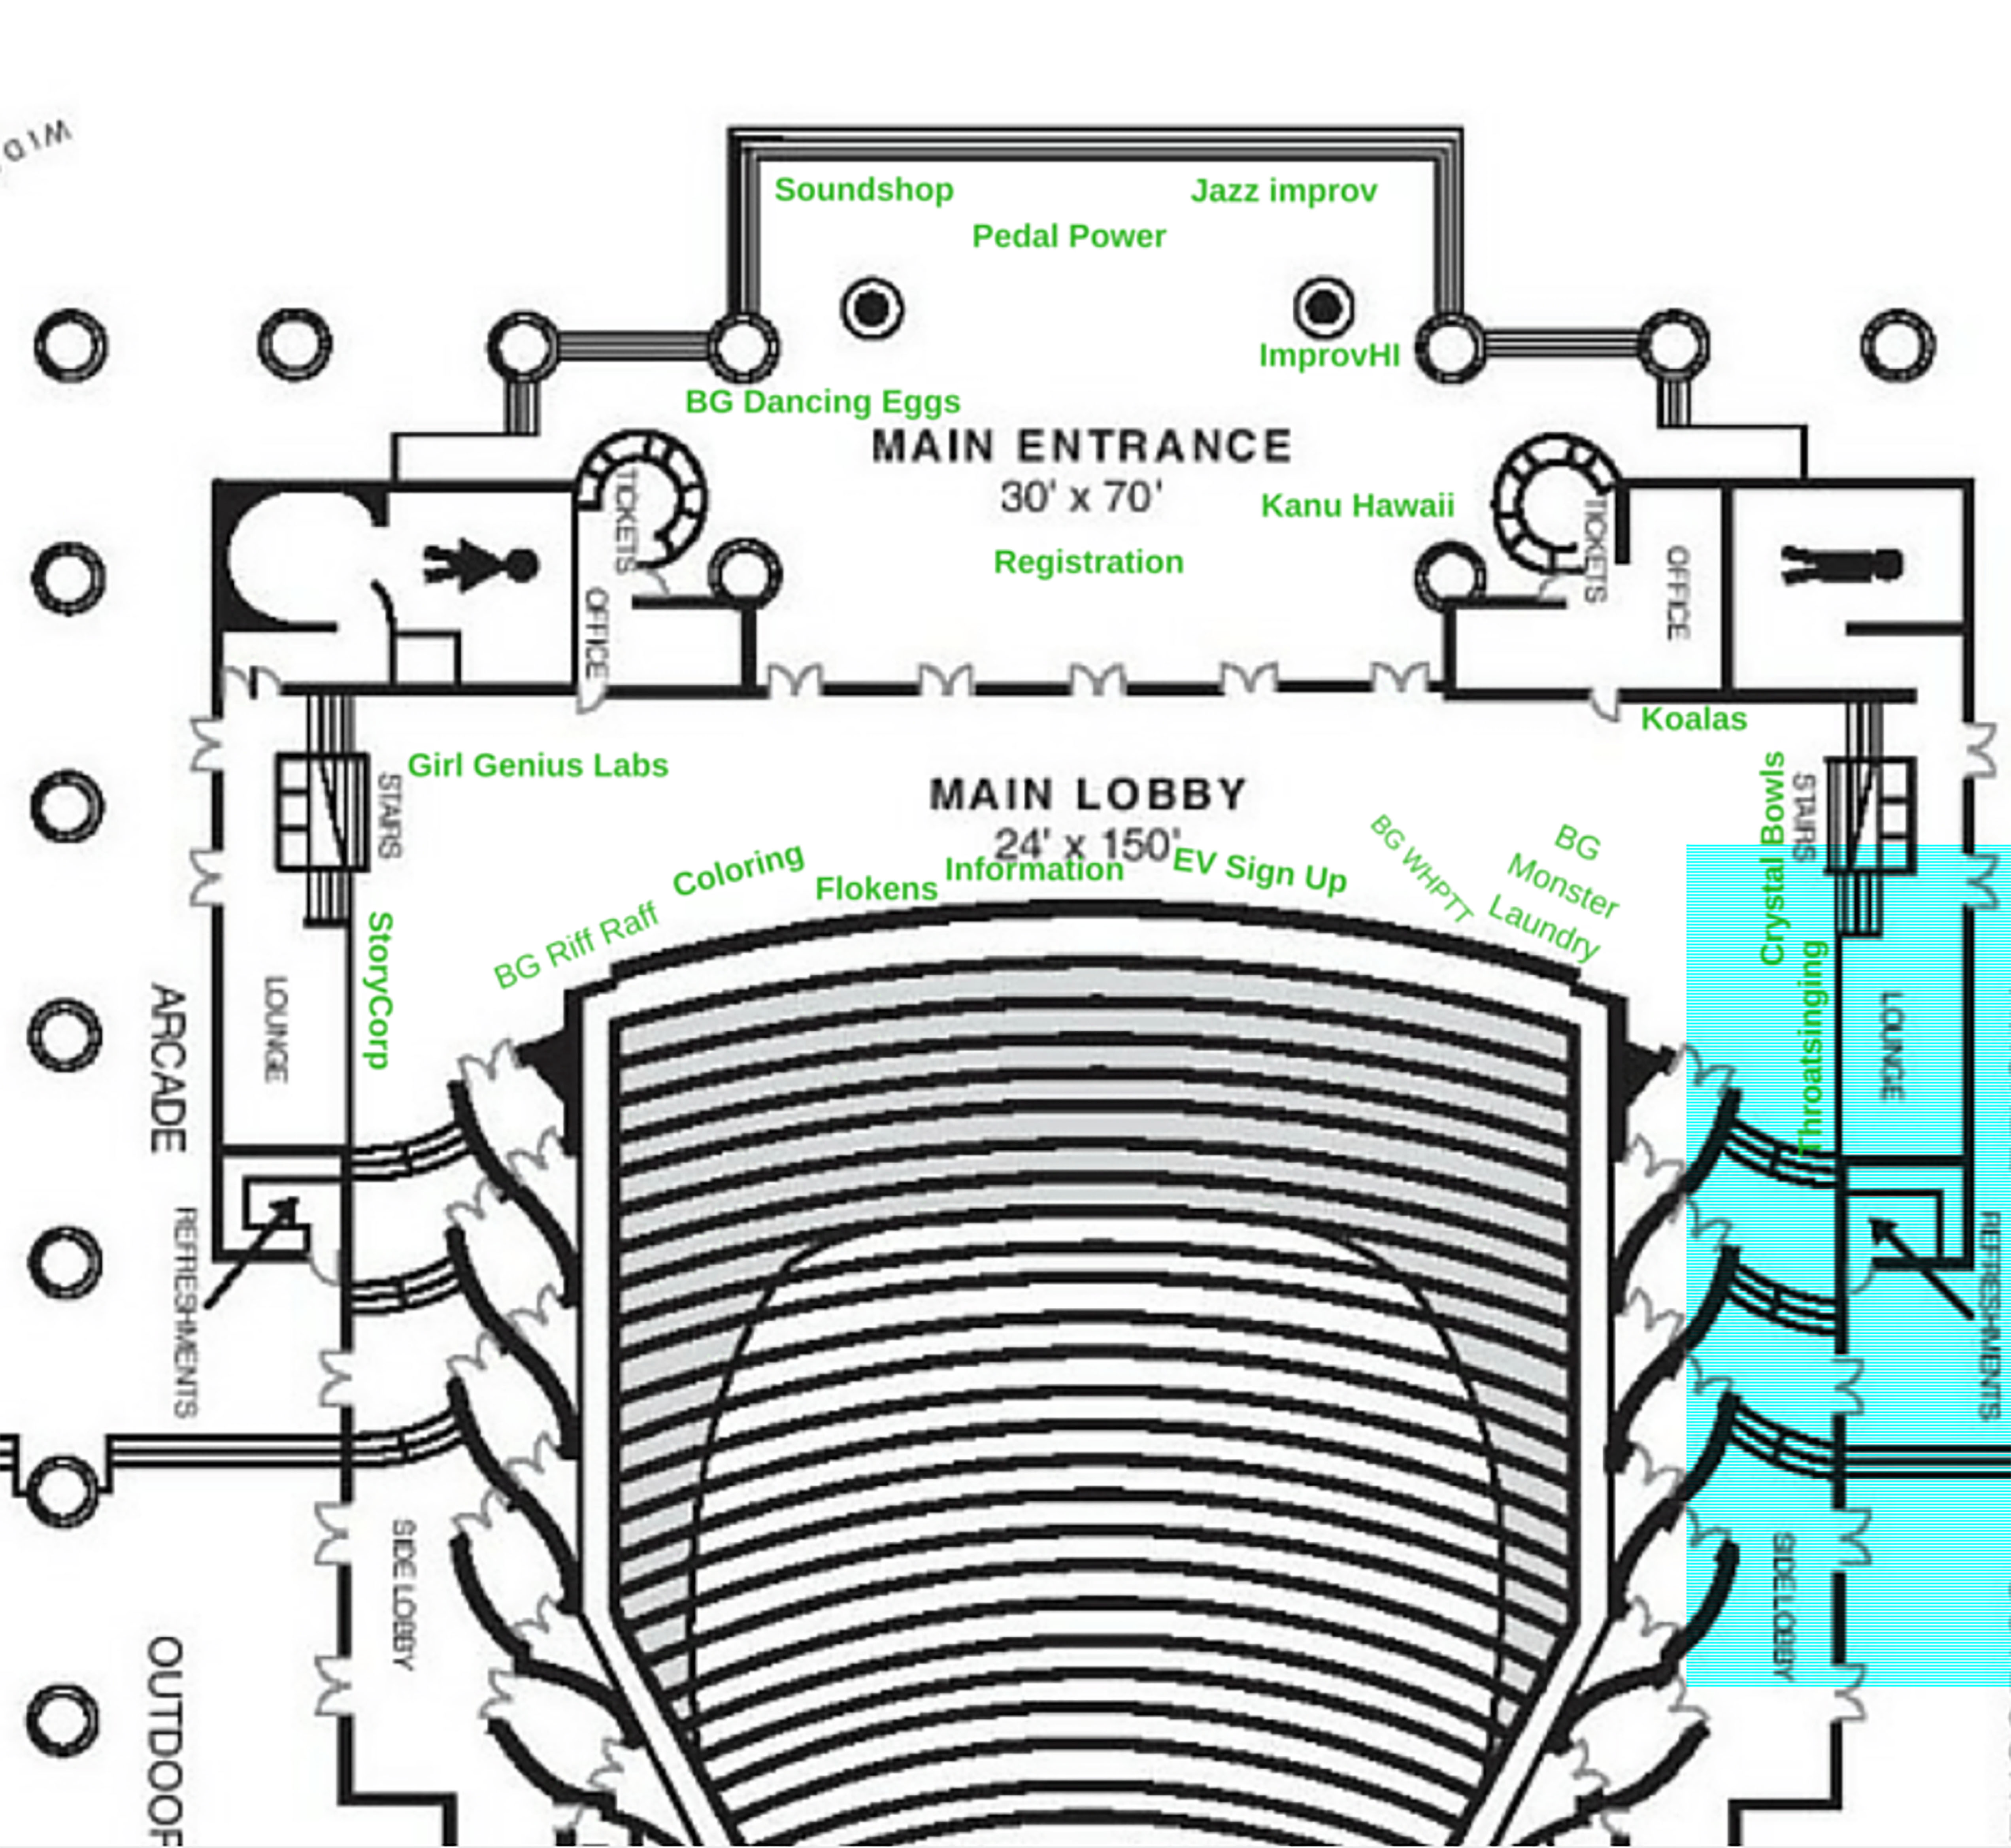
Floor Plan and assignment areas
